To complete this project you’ll need:
- Raspberry Pi 3B or better.
- MicroSD Card 8GB or larger.
- A free account at https://dakboard.com/
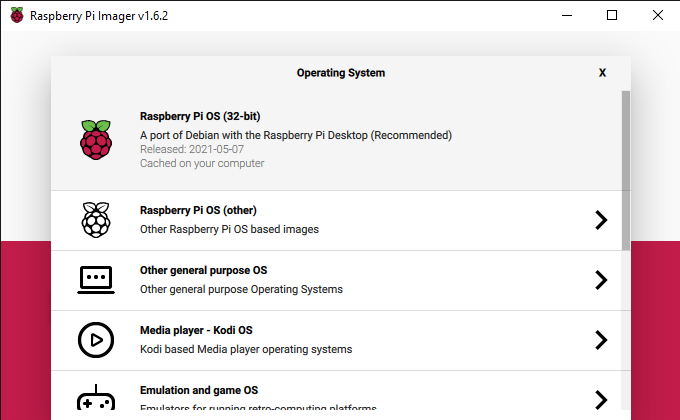
- Raspberry Pi Imager software.
- Monitor/TV for displaying the dashboard, I’ll be using a 24″ monitor I had around.
- HDMI cable (at least on the Raspberry Pi side), I’ll be connecting to my monitor with a HDMI to DVI cable since the monitor is older and doesn’t have an HDMI port.
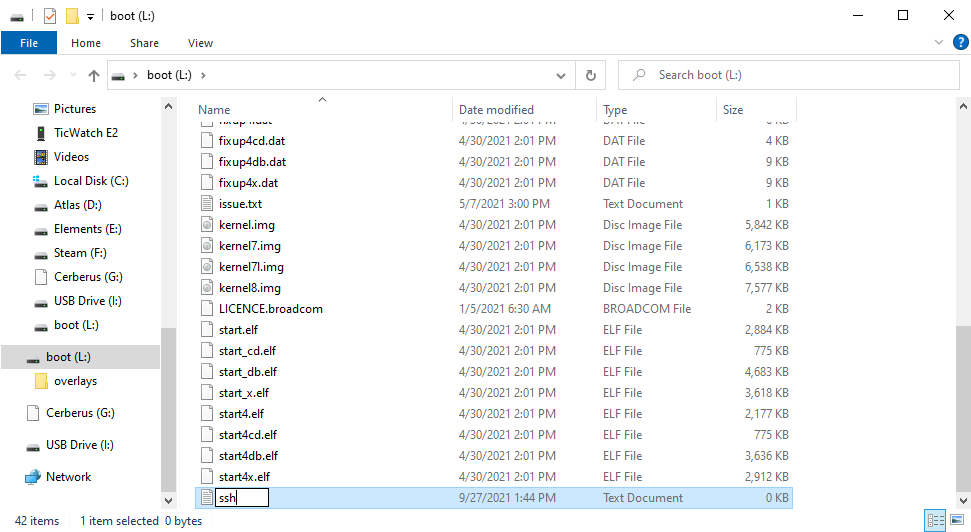
- PuTTY or an equivalent tool for SSH communication.
- Wi-Fi available for the Raspberry Pi 3B to connect.
Configure Your Pi 3B
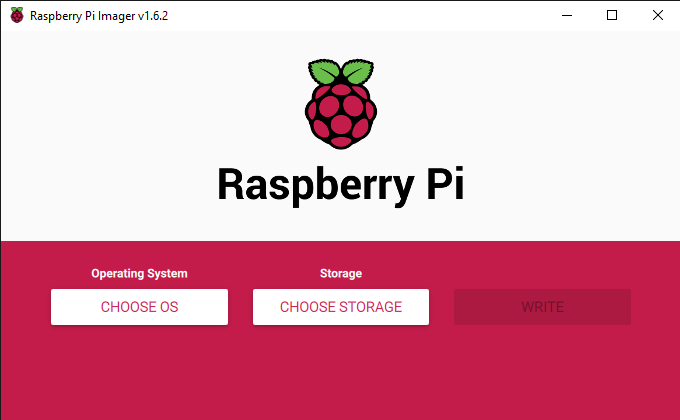
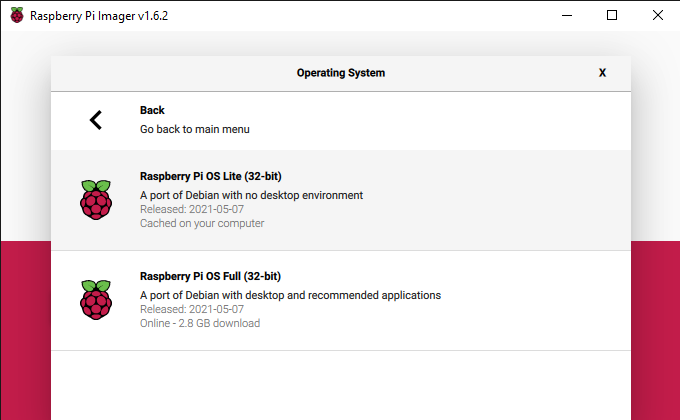
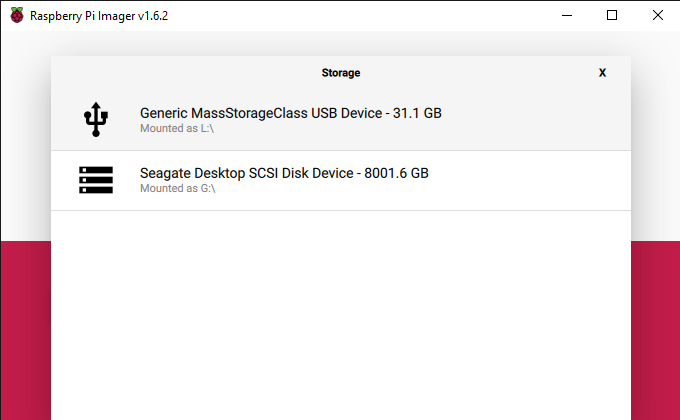
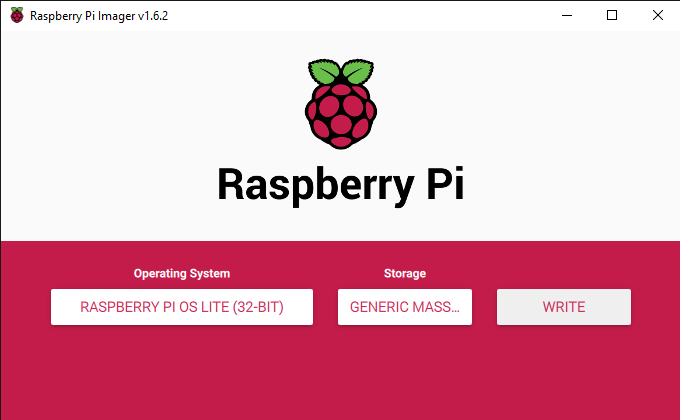
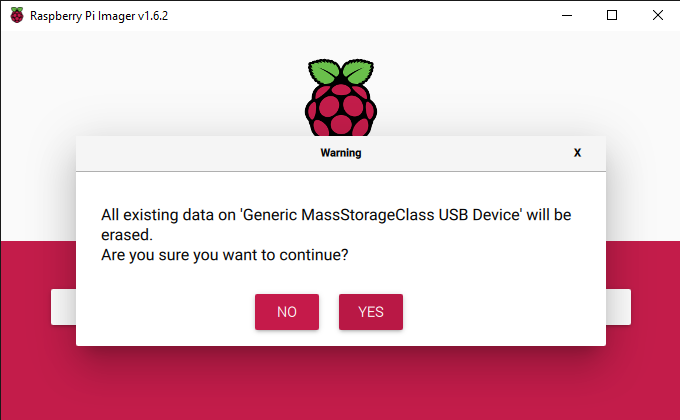
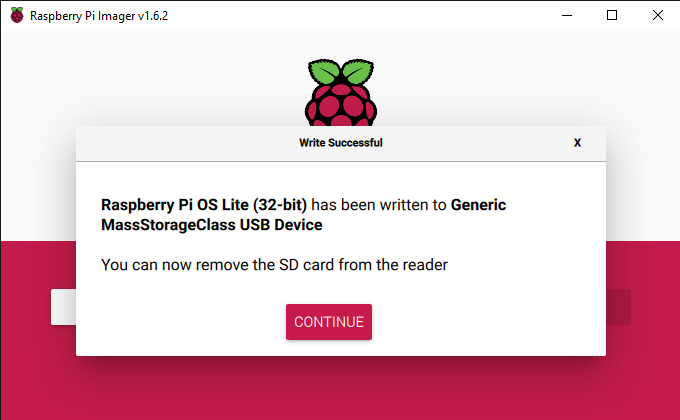
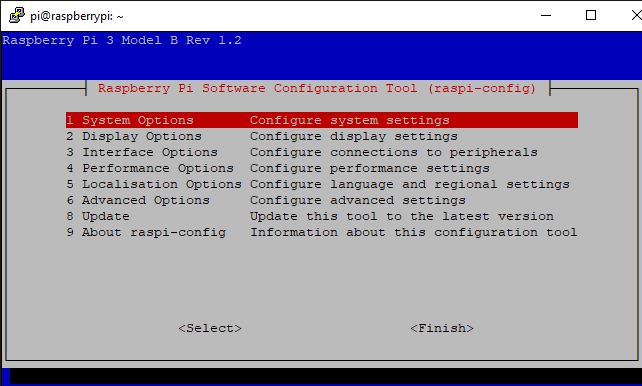
This project, like the others, is just like Air Quality Project #1 so we’ll want to refer to the exact same steps for configuring the Raspberry Pi device. If you don’t already have the Pi device configured feel free to refer back to “Raspberry Pi Air Quality Project #1” to follow the configuration section before continuing here. Since this project will be attached to a monitor, we’ll want to use the “Raspberry Pi OS (32-bit)” choice when imaging our MicroSD card.
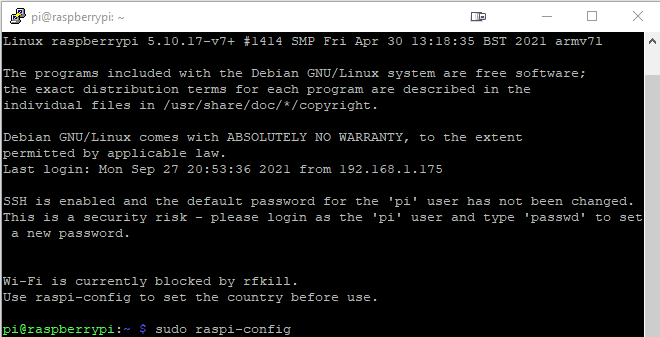
Connect to your Raspberry Pi
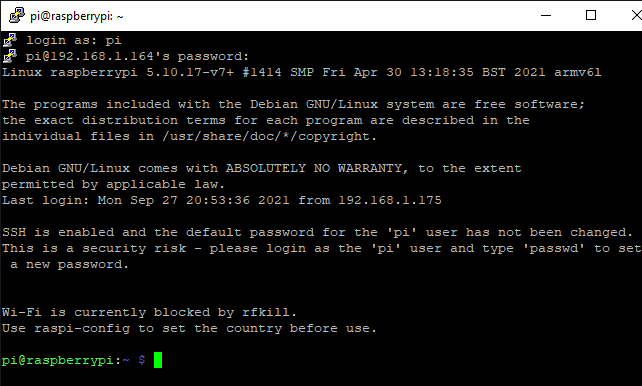
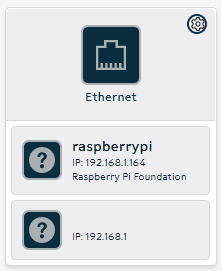
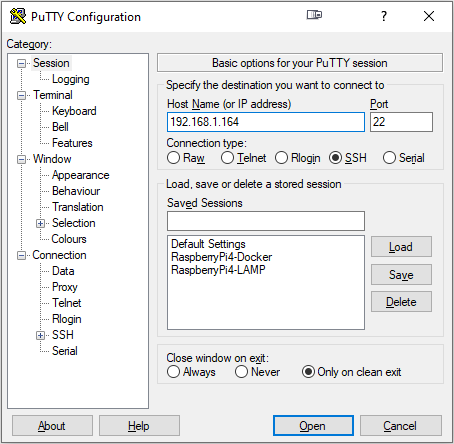
With your Raspberry Pi device connected to the WiFi, you can log into your router again, just like in Air Quality Project #1 and #2, to find the IP address of the Pi 3B. With that IP address, you can open PuTTY and create a new session and enter the IP address and default credentials for the Pi device, or if you’ve already customized the credentials – use those.
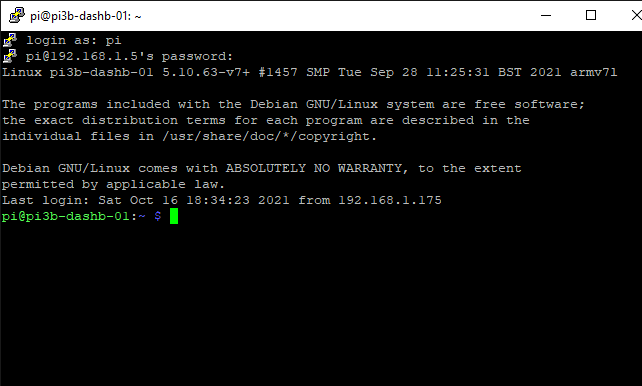
Additionally, if you’re noticing any lag while communicating with your WiFi-connected Pi 3B over SSH, you can directly connect a keyboard/mouse and monitor to your Pi and enter the following command into a terminal window and reboot your Pi device, as we did in Raspberry Pi Air Quality Project #2.
echo "IPQoS 0x00" >> /etc/ssh/ssh_config && echo "IPQoS 0x00" >> /etc/ssh/sshd_configNavigate over to dakboard.com to create a free account if you haven’t already
You can do this in a new tab or new window but you’ll need to create a free account on https://dakboard.com and sign in.
Once you are signed in you can follow these steps to customize your free “Predefined Screen”,
1. Click the "Screens" button in the left hand menu.
2. Click "My Predefined Screen".
3. Layout Tab - Here you can decide the layout of your screen, for my display I've chosen "Top/Bottom".
4. Background Tab - I am leaving this default but this tab is where you can choose to connect a photo account or enter a custom URL for photos to use on your display.
5. Calendars Tab - Be sure to click "Calendar Enabled" to turn this feature on. I'll be setting my "Calendar Type" to "Monthly" and "Weeks to Show" to "4 weeks (1 month)".
6. Calendars Tab - At the bottom, under "Calendars" you can upload an iCal, ICS, or connect a Google Calendar. For my display, I've connected my Google Calendar.
7. Date/Time Tab - Again, be sure to click "Date/time Enabled" to enable this feature. Below that you can change the time zone, clock type, time format, show seconds, show AM/PM, and change the date format.
8. Weather Tab - You can change your weather source but I've left mine as the default. Edit your location to ensure the weather on your display is accurate. You can change your units here from Fahrenheit to Celsius and have the extended forecast as "4-Day", "5-Day", or "Off". I've selected "5-Day" for my display.
9. News, Todo, Custom Message Tabs - We won't be configuring these features today but feel free to play around with them to create a dashboard that suits your needs.
10. Settings & Defaults Tab - This is where you can get your "Private URL" to use in the next section. Additionally you can give your dashboard a name for identification purposes.
Configure the Pi device to display your dashboard on boot
To make sure the Raspberry Pi goes back to displaying your dashboard upon reboot, we’ll want to make the following changes to the global autostart file.
You can open the autostart file in Nano with the following command,
sudo nano /etc/xdg/lxsession/LXDE-pi/autostartWith the autostart file open, you’ll want to make the following modifications.
@xset s off
@xset -dpms
@xset s noblank
@chromium-browser --noerrdialogs --incognito --kiosk YOURDAKBOARDURLHERE
With those changes made, you can press Ctrl + X, press “Y”, and press “Enter” to save the autostart file.
Test your new dashboard
Now that you’ve configured your one predefined screen on Dakboard, and configured your Pi device to display it on boot, you can reboot your Pi device to test and make sure it’s working as designed. Additionally you can edit your dashboard using the Dakboard interface and update your display on the fly by clicking the “Send Changes to Display” button.
You can reboot your Pi device with this command.
sudo reboot nowWith your configuration changes to the Pi and Dakboard you should be seeing something like this.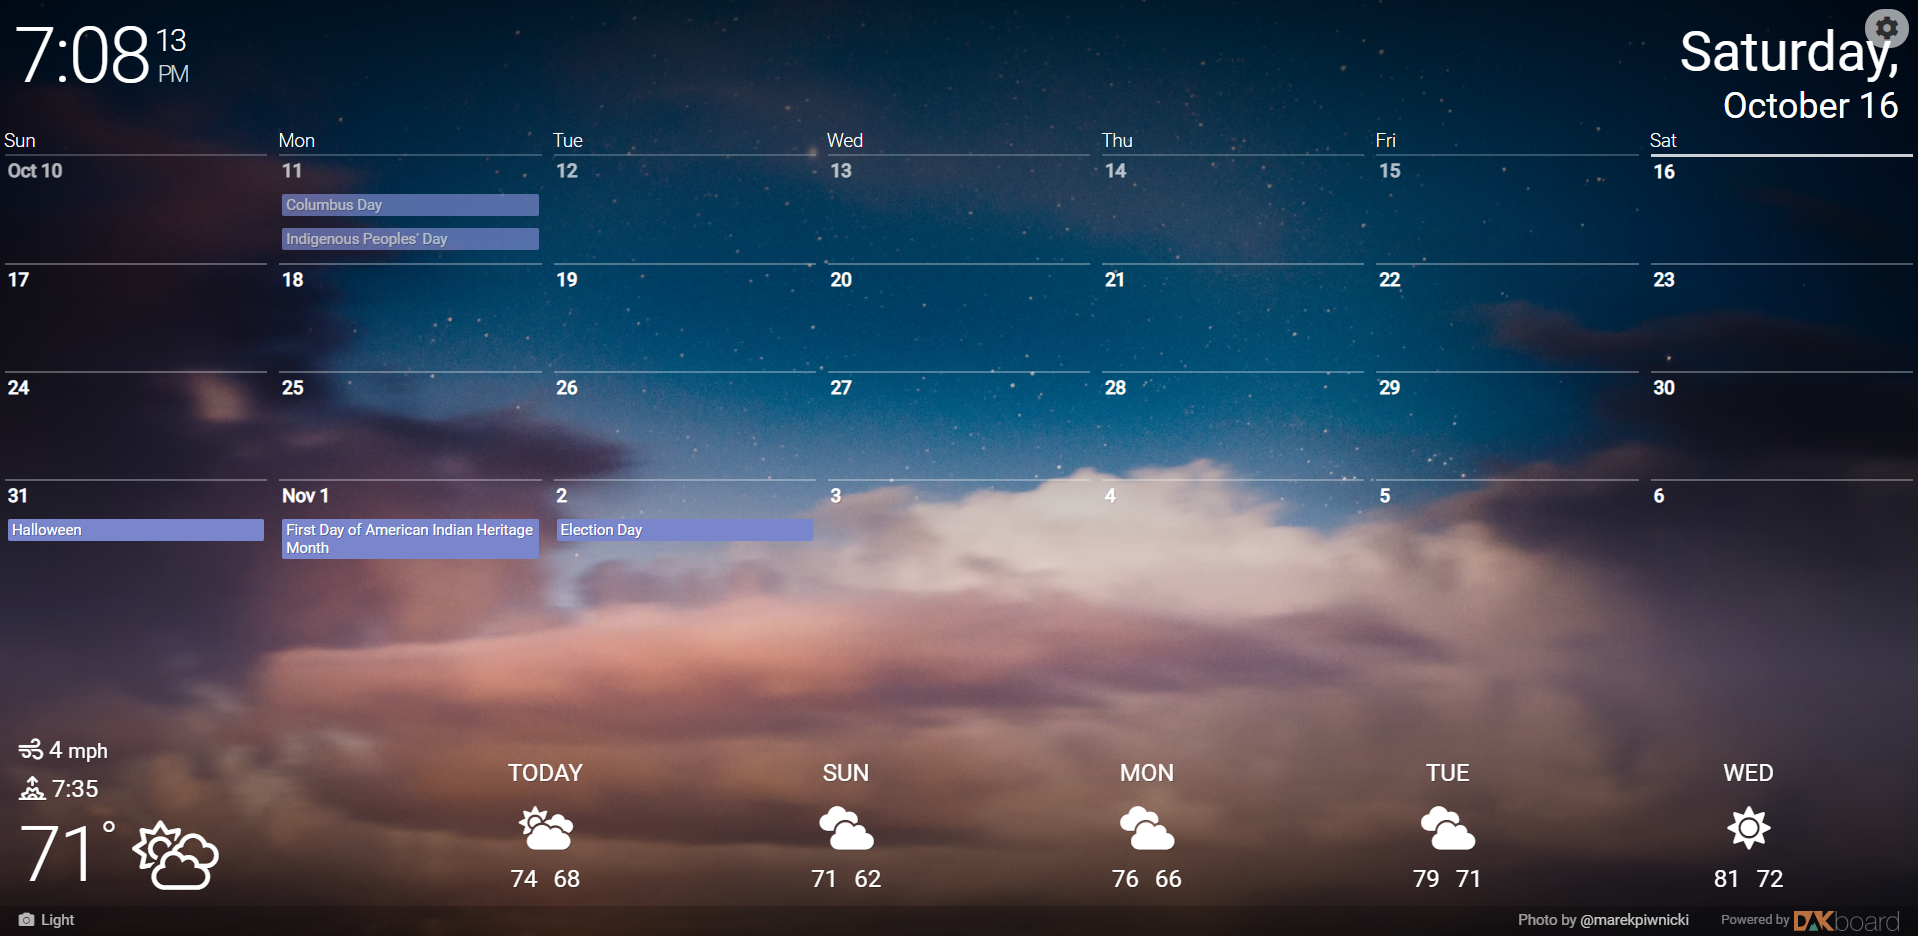
Let me know what you think and if you went in any different directions with the configurations. I’m interested in seeing how people are creating these to meet their own needs. I feel like there is a lot that can be done with it!